
Twitter advertising’s self serve platform has now been live in the UK for a couple of months, however few results have emerged publicly. We’ve been running a few campaigns recently that have seen some interesting results, and some really positive return on investment for our clients.
From a platform perspective, it’s really interesting to see some of the data that Twitter share on a results basis in your campaigns. To this end, we created a brand new Twitter account and spent just a few pounds on some ads so that we could show you some of the types of data you see within the platform when advertising!
Once your campaign is up and running you can access the campaign performance section and see some really interesting data. One of the more interesting sections is the @handles performance, as shown below:
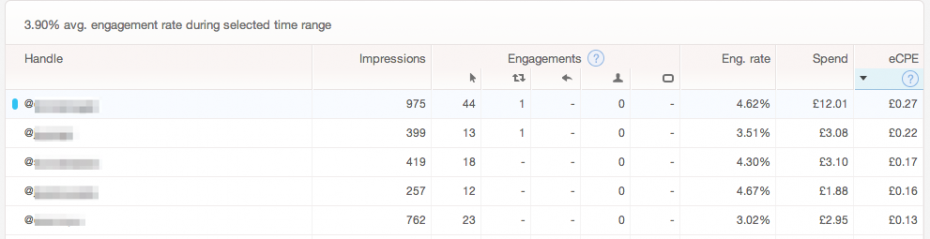 This shows you how your promoted Tweet has performed in terms of users who follow certain @handles that you targeted. It is really revealing when you see which @handle followers are cheapest in terms of effective cost per engagement (eCPE).
Next, you can view your campaign data by device type:
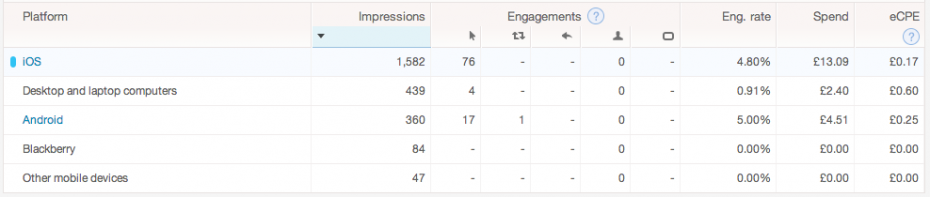 This allows you to see where changes need to be made, either in terms of your targeting or in terms of your content and site. In this example, iOS devices are performing best in terms of eCPE, with Android second and desktop/laptop computers being more expensive in terms of eCPE. This is a commonly seen trend in our Twitter advertising campaigns, primarily because Twitter’s users are more often on the mobile version than desktop, leading to increased competition and therefore higher costs in the desktop and laptop slots.
Location data is another key element that you can display in your Twitter advertising dashboard:
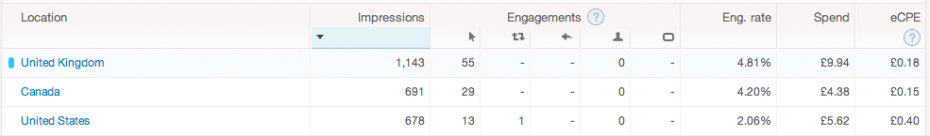 This shows that people in the United States are costing a lot more per engagement, with Canada in fact being the cheapest in this example. In this scenario you would consider either changing creative for a United States specific advert, or turning the adverts off for that market to focus on the more efficient UK and Canadian markets.
The interest section of the dashboard shows interest categories as defined by Twitter and how people in those segments have interacted with your sponsored content:
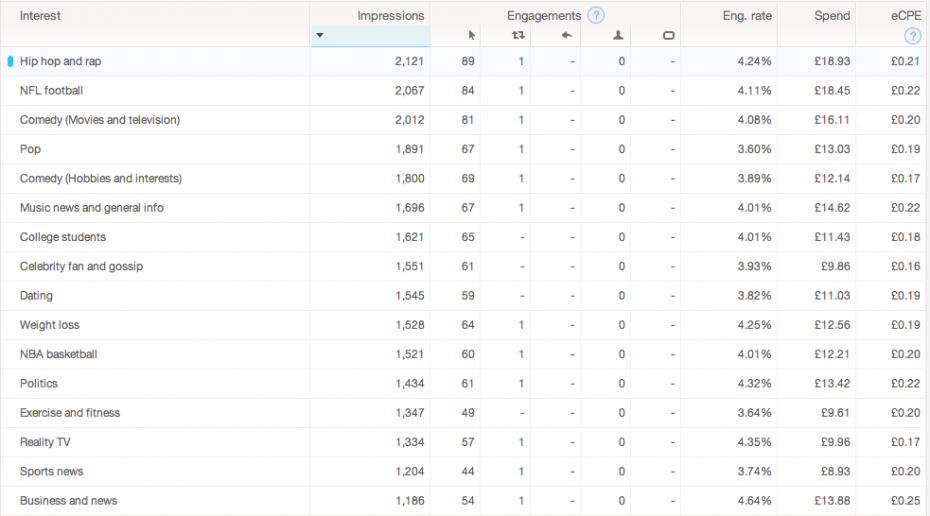 Whilst the interest sets are harder to optimise for immediately, they offer interesting insight into who is interested in the content you are promoting on Twitter. This helps to create future content ideas, particularly for around further engagement rather than ROI driven posts such as this one.
There is also the capability to segment your campaign by gender, and by the Tweet you are promoting to allow you to optimise your creative and which gender you are going to target more based on clicks and engagement.
Twitter advertising’s platform is very user friendly and offers up some interesting data to help you improve your campaign over time. This in far in advance of what Facebook has offered in terms of breaking down your ad campaign in the native environment and is therefore very welcome for advertisers.