Facebook announced their latest upgrade to page insights on 19th June on their studio blog. They have stated that this is an attempt to clear up their metrics and to make it much easier for people to find out what’s working on their page. I’m one of the lucky ones to have an early roll out (unlike with Graph Search & new News Feed!) so have taken the new insight for a test drive.
Early impressions are good, very good. The look & feel is consistent with the other changes Facebook has been rolling out and really does look much cleaner and much stronger. But the real advantage is in the new break outs of the data.
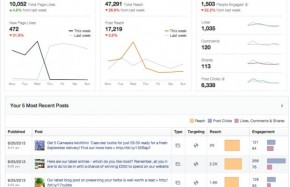
Number of people engaged is a new metric and is a combination of people who liked, comments, shared or clicked your post – and these metrics are also broken down individually. The post engagement is filterable and much clearer to the eye. This is all great at an internal page level. This is to replace PTAT, which in theory is a great idea. However, the issue may come when the whole of Facebook switches to these new metrics as it depends what Facebook include in the OpenGraph space as to whether competitor engagement can still be tracked.
The key new data though is in the people tab. Instead of simply showing you your pages demographics, it now breaks this out vs the Facebook average. It also goes a step further and shows the percentage of reach you are getting from each demographic vs your audience in ach demographic, and your engagement in the same way as below:
This is a really neat way to see how your content strategy is working in terms of demographics. If you’re reaching more 18-24 year old men, but your primary engagement is coming from 45-54 year old women you know something is going slightly wrong for instance. In the above pictured case the graph looks fairly natural, but perhaps shows that less focus should be put on acquiring new fans int he 25-34 age bracket, and more in the 45-65+ as they over index in their engagement vs their audience percentage.
Another new and handy feature is the “When Your Fans Are Online” graph, located under the Posts tab. This graph shows the average number of your fans who saw any posts on Facebook (not limited to your pages) in a given hour. This, again, is really helpful when planning content scheduling as in the below case you can see that, in theory, the ideal time to post is at about 8pm. However, this may mean more competition, so a comparison to number of posts seen as well on this graph would be even more useful:
All in all, I think this is a really strong Insight update, providing more data in a clearer fashion. The key to it will be how it integrates into an API when the full rollout is complete and how this affects any open metrics (which PTAT currently is). Hopefully engagement for competitors can still be tracked so that pages can benchmark their performance accordingly.