The following is a rough transcript of my deck from eMetrics San Francisco on the 19th March 2014.
If you want to read this along with the slides, they can be viewed from slideshare below:
Transcript
Good afternoon. What a great conference this has been so far, I’ve certainly learned a lot and hopefully you have too. My session is going to continue the marketing data theme, by covering the topic of “Using Data To Lower Your Facebook Cost Per Acquisition”. First of all though, who am I? I’m Ben Harper, co-founder of Datify, and the token British person on the bill! You can reach me on any of these details, and please feel free to tweet me @benharper87 at any time during or after with any questions or comments.
Datify are a data driven digital marketing agency with specialisms in social, data & search. Our experience in the social and data arenas is what we’re going to be focussing on today. We work with a number of clients in the UK and in the States helping them optimise their Facebook ads and deliver stronger results by using data, and I’m going to show you how you can achieve this too.
We follow a three step process with our clients. We’ve used this for a couple of years now with great success. The process is Data Insight > Smarter Targeting > Aggressive Optimisation.
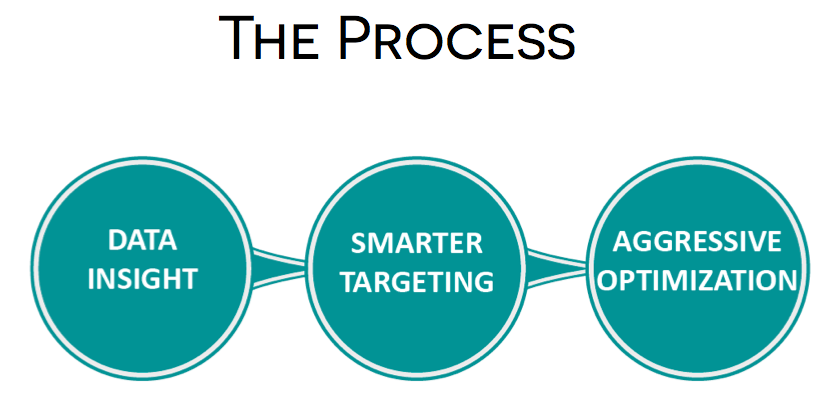 By following this process you can achieve great things with your Facebook advertising efforts. It’s been well documented how Facebook ad revenues are continuing to grow. Here’s their quarterly figures for the last couple of years, and as you can see Q4 2013 saw a 30% rise in advertising revenue on Q3. Great news for Facebook, but for us marketers this means two things - firstly, that others are having more confidence in the platform and therefore we should perhaps give it another go, but more importantly that the competition is growing so we need to be smarter to get ahead.
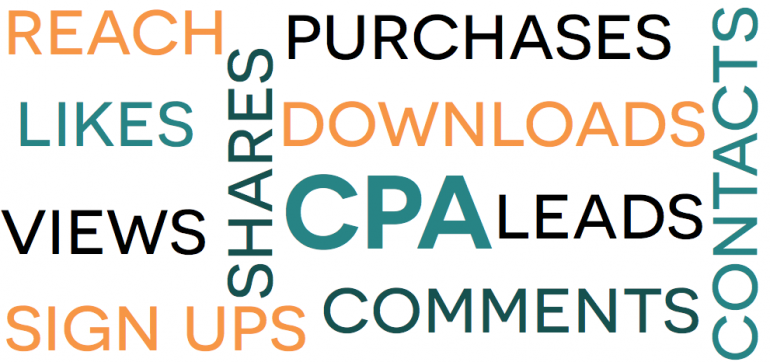
Your CPA on Facebook will largely depend on exactly what you’re classing as an acquisition in your campaign. This could be almost anything from leads, comments, downloads, purchases, sign ups and more. Regardless of your goal, integrating this three step process into your strategy can help you decrease your CPA. We’ve done this for marketing companies looking to increase their newsletter sign ups, e-commerce stores looking to increase sales, and even construction firms looking to generate leads and it hasn’t failed yet.
So let’s look at a little data to justify what I’m saying. Here’s a fairly standard CPA vs Total Conversions graph. As you can see, from July the CPA plummets and the number of total conversions increases. Great news for that business. But here’s what actually happened:
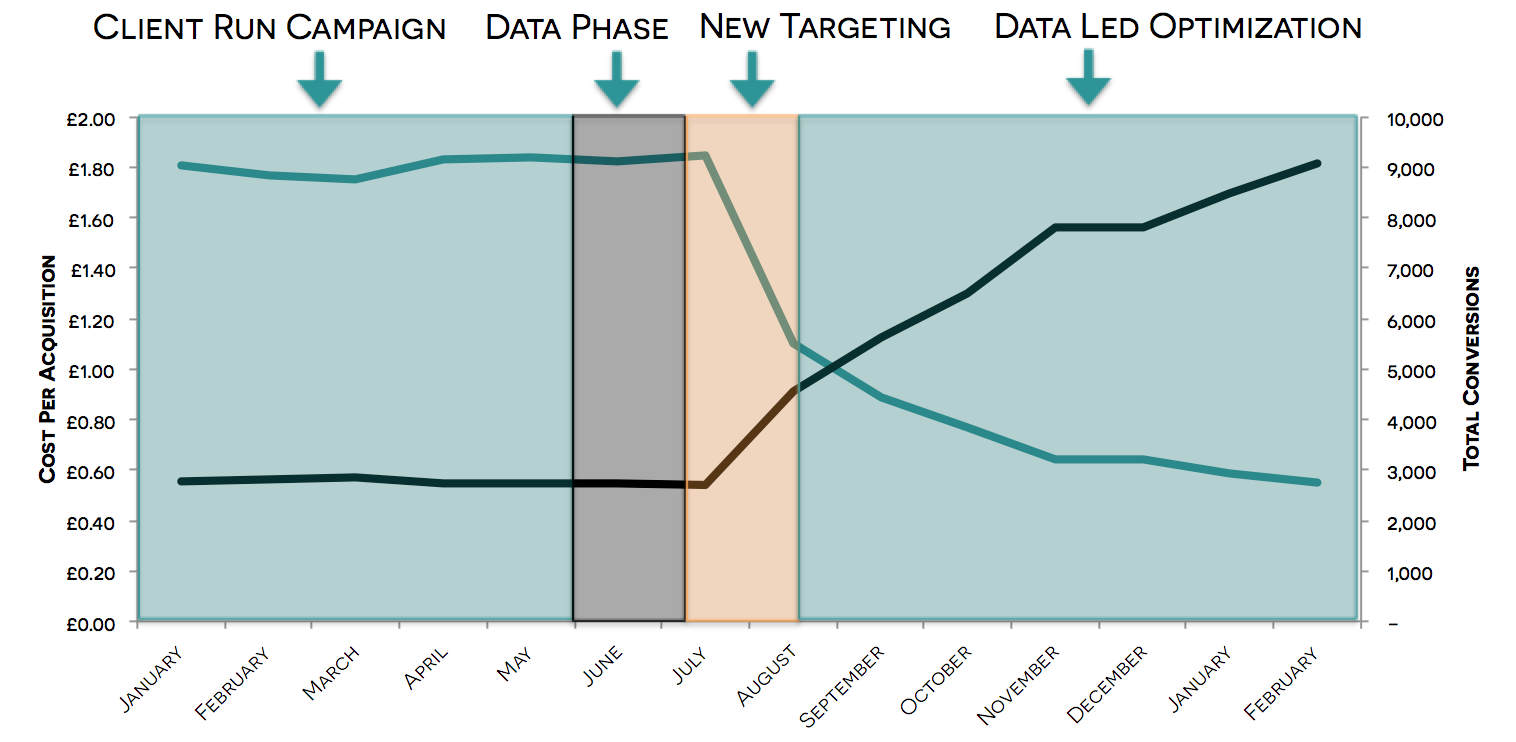 By overlaying the three steps of our process, it shows the impact that each can have. As soon as the new targeting was implemented following the data phase, the CPA dropped significantly, but importantly not at the expense of total conversion numbers. The data led optimisation phase led to a gentler decline in CPA, but an increase in the number of total conversion as we become more confident in the validity of the data and can increase spend levels.
So on average for our clients over the last few months we’ve achieved a 70% decrease in cost per acquisition, and a 229% increase in total conversions. Hopefully that grabs your attention, and leaves you wanting a little bit of that for your company! Well, here’s how to do it.
Step 1: Data Insight
The first thing to thing about in the data insight phase is your data sources. What we’re aiming to achieve at this stage is a higher level understanding of the audience so that we can create better targeting sets that will have less competition, less wasted impressions, and a higher quality of audience when we relaunch any campaigns. Depending on your business, you may have some great data sources in house such as your CRM which can help you at this stage. This will all depend on how advanced you are with your data. As standard for our clients, we look at the following sources as a minimum, and with these you can get some great insight.
The first is Facebook insights. Facebook insight has improved a lot as a data source over the last 6-12 months, and now has some really useful info to get your teeth into. Start with the standard metrics such as page likes, page reach, and engagement. Studying these to see peaks in engagement and likes can put you on a path to finding better data. For instance, we saw with a client that they had a lot of engagement on a certain day and it was because they had posted a topical post about politics for the first time. They had no political affiliation and had never discussed that kind of topic before, but it really resonated with the audience which told us that fans of their brand may have a higher interest in politics than the average user.
Where Facebook insights is a little more data led is in the section that shows your audience demographics. This is particularly useful as you can see three graphs, the first showing your fans broken down by demographic versus the total Facebook audience, the people you’ve reached broken down by demographic versus your page audience, and the people you’ve engaged by demographic compared to your page audience. This allows you to see where you are over and under performing in terms of reach and engagement, and also what age band and gender your audience is more likely to fall into. If you see that your audience are over-indexing in the female 45-54 category for instance, and that this is the case on reach and engagement too, then this gives you a pretty good sign that these are the people to include in your segmented targeting sets later on.
The second source is still based on Facebook’s own data, but is even better. Power Editor is Facebook’s bulk editing tool, and is something I talk about a lot. Power Editor is great for helping you to extract the kind of data we’ve been talking about above but on a larger scale. With Power Editor you can quickly set up ads that will never need to go live and define targeting options to define the potential audience - this will let you know the scale of the potential audience you can target and therefore can be used to help decide your targeting options. Power Editor also gives you a whole range of extra options for testing data, such as segmenting by major, workplace, and more.
Google Analytics is another good source. If you haven’t upgraded to Universal Analytics yet, you can still get hold of the affinity categories data. This allows you to see the interests of your website audience. This provides some really interesting data that correlates with Facebook’s interest targeting - if a certain interest category has a high affinity in your website audience in Google Analytics then consider targeting that as an interest set.
Another source we use a lot is Optimal Social. Optimal’s expander is particularly useful. When on a free trial you can type in your page and ask Optimal to tell you what else people who like your page like. This gives you a ranked list of interests and brands, which are priceless when considering how you are going to set up your targeting sets.
Other data sources can include your CRM, and anywhere else you can draw out data about your audience. This might include Google, WordPress, LinkedIn, YouTube, Twitter and more. It all just depends where you have a presence and where you have the ability to get data from. At this stage the more the better.
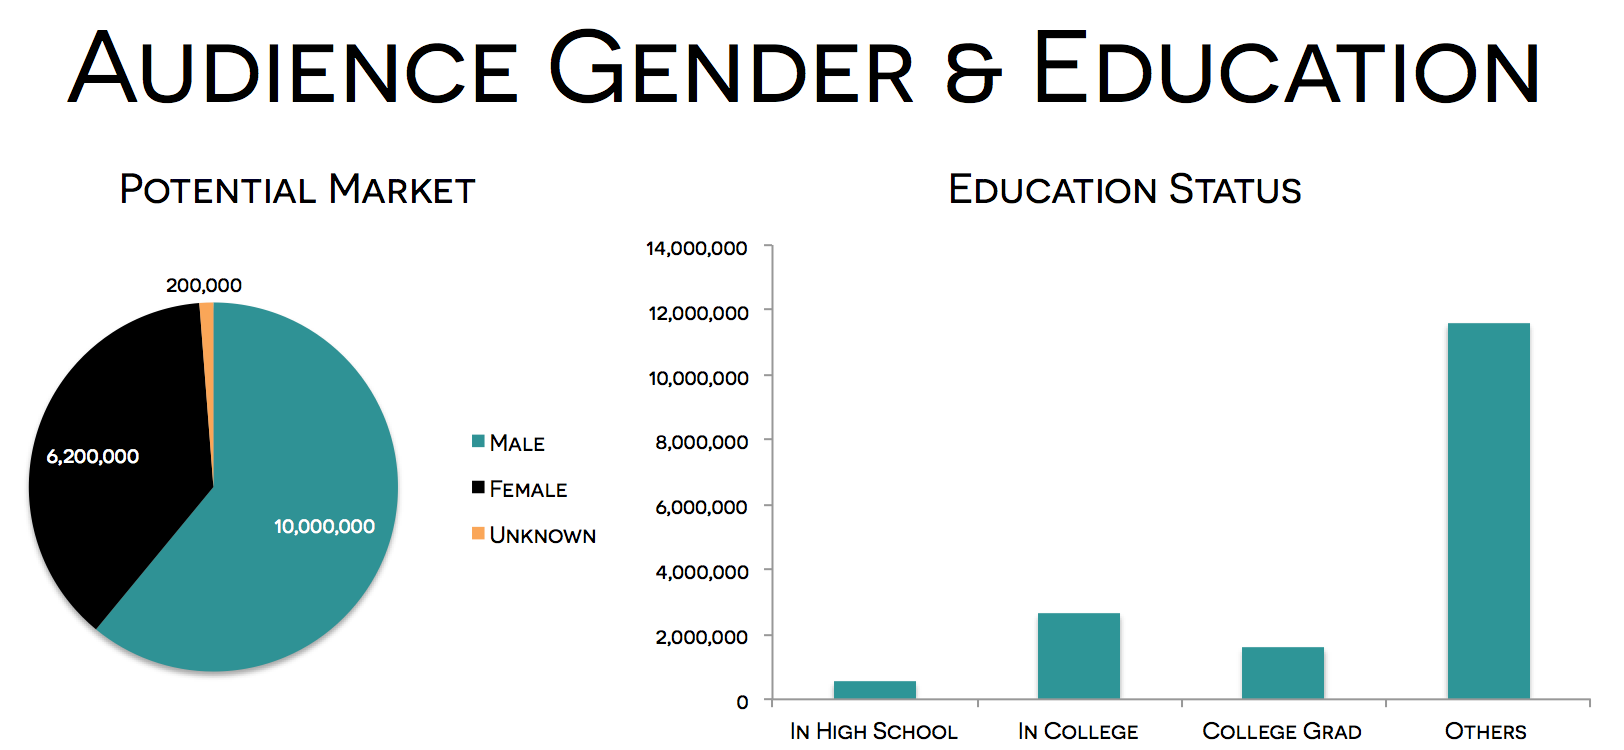
The key with this data is to create insight such as in the following graphs. These can really focus your mind and your targeting sets, allowing you to achieve strong results at the next step. Some examples here include looking at the market potential versus the total US Facebook audience by age to show that your ideal targeting set will be between the ages of 18-30, what interests rank highest amongst your current audience, the education status, gender, location and more of your best fans/audience to allow you to target more of them as we move forward.
 Step 2: Smarter Targeting
A good quarterback considers the receiver when choosing a pass type to increase their pass completion rate. That’s exactly what we’re doing here - we now know the ideal people we want to ‘receive’ our advertising on Facebook, so we have to consider how to target them, and what to target them with.
This starts off with segmentation. There are four elements to consider when it comes to segmentation:
- Goals
- Competitiveness
- Similarities
- Tracking
What you need to decide is how to segment based on these things. You need to ensure that you can track properly, and that might mean segmenting in a certain way for instance. Your audience data might show that your target audience is particularly interested in personal finance, a highly competitive niche for advertising - in which case it may be worth segmenting your targeting sets based on audience size (and therefore competition).
The key is to create good targeting sets. Here’s an example of good vs. bad targeting sets:
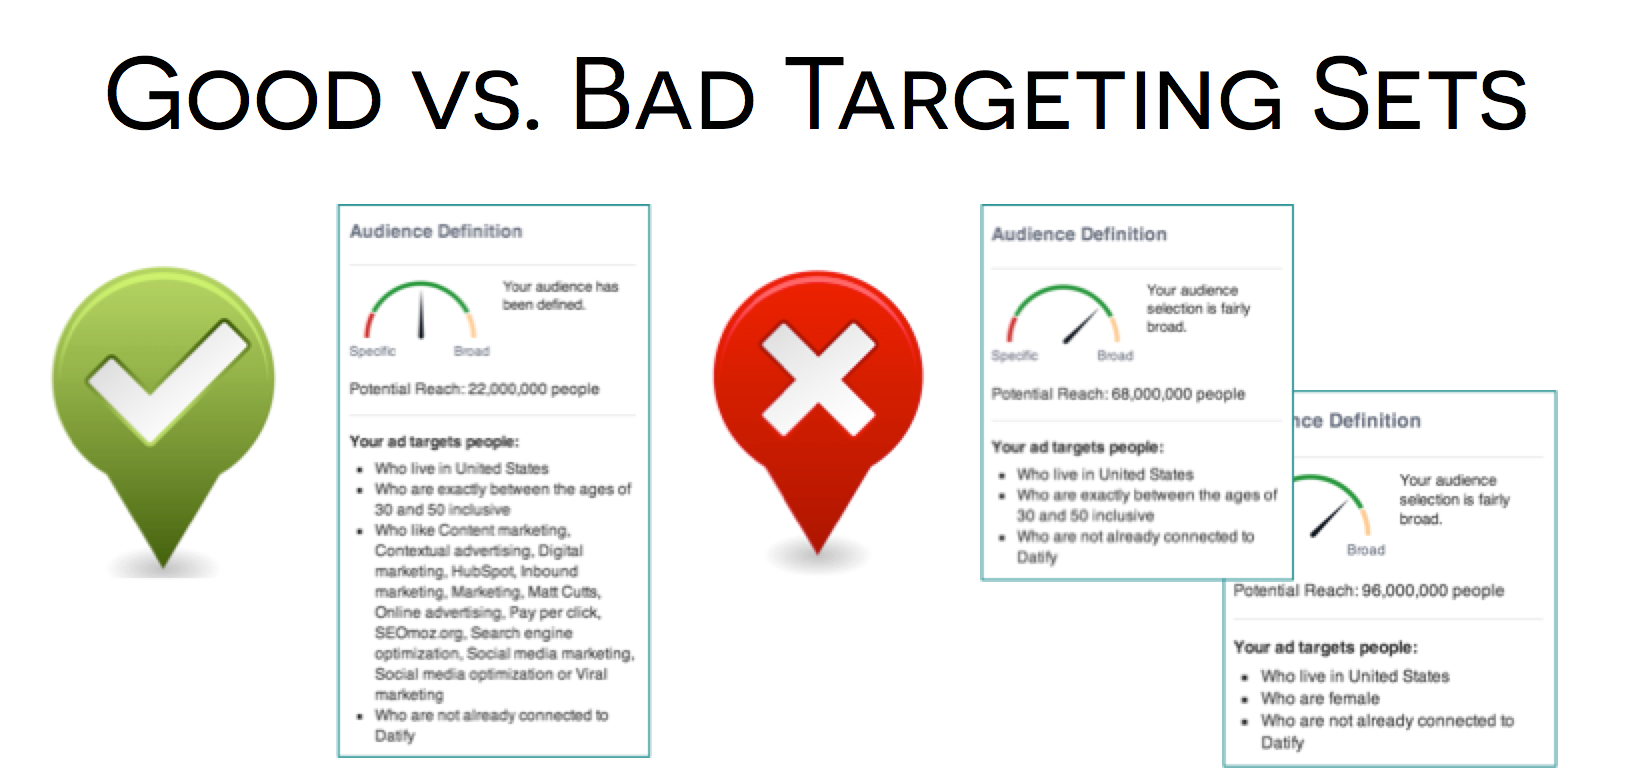 It’s amazing how many advertisers are still going too broad with their targeting sets. Facebook’s Specific - Broad measurement doesn’t really help, as just targeting everyone in the USA who is female doesn’t show as too broad, when clearly it is. You want to be aiming for specific age ranges and a few interests as a minimum in a targeting set.
The next consideration is to tailor your creative based on your new found audience knowledge. Don’t let your ads team be lazy and just create 3 or 4 versions - create tailored ads that will work for the different segments of your potential audience that you are focussing on. Make use of Power Editor to affect placement, consider dark-posts, and use Facebook’s new call to action buttons where appropriate to increase clicks. The key is to ensure that your ad is as relevant as possible - as we’ve segmented the targeting sets and got more advanced from the initial data in our targeting, use this knowledge about the audience to create advertising that they will want to interact with.
The final point in the smarter targeting section is around account structure. Facebook campaigns can get messy quite quickly, making it difficult to keep a track on performance. Unlike AdWords, Facebook only has campaigns and ads, rather than Ad Groups. Due to this, ensure that you set your campaign up with no more than 5 ads per campaign - this will unfortunately mean you have a lot of campaigns running, but having more than 5 ads per campaign will be a waste as Facebook tends to serve one or two ads and ignore the rest after a very small test.
Step 3: Aggressive Optimisation
Next, we move into the optimisation phase. This is the stage where we increase the total conversions whilst maintaining and continuing to decrease the CPA level. This is the step in the process that most people seem to forget about as they’ve lowered their CPA from their new targeting sets and are content with that. However, to scale up your conversions and maintain performance this is critical.
There are three main elements to consider with optimisation, with a few other sub rules that are important. The three main elements are creative, targeting and placement.
If you’ve set your campaigns up something like this, you are able to quickly optimise your targeting sets based on CPA levels:
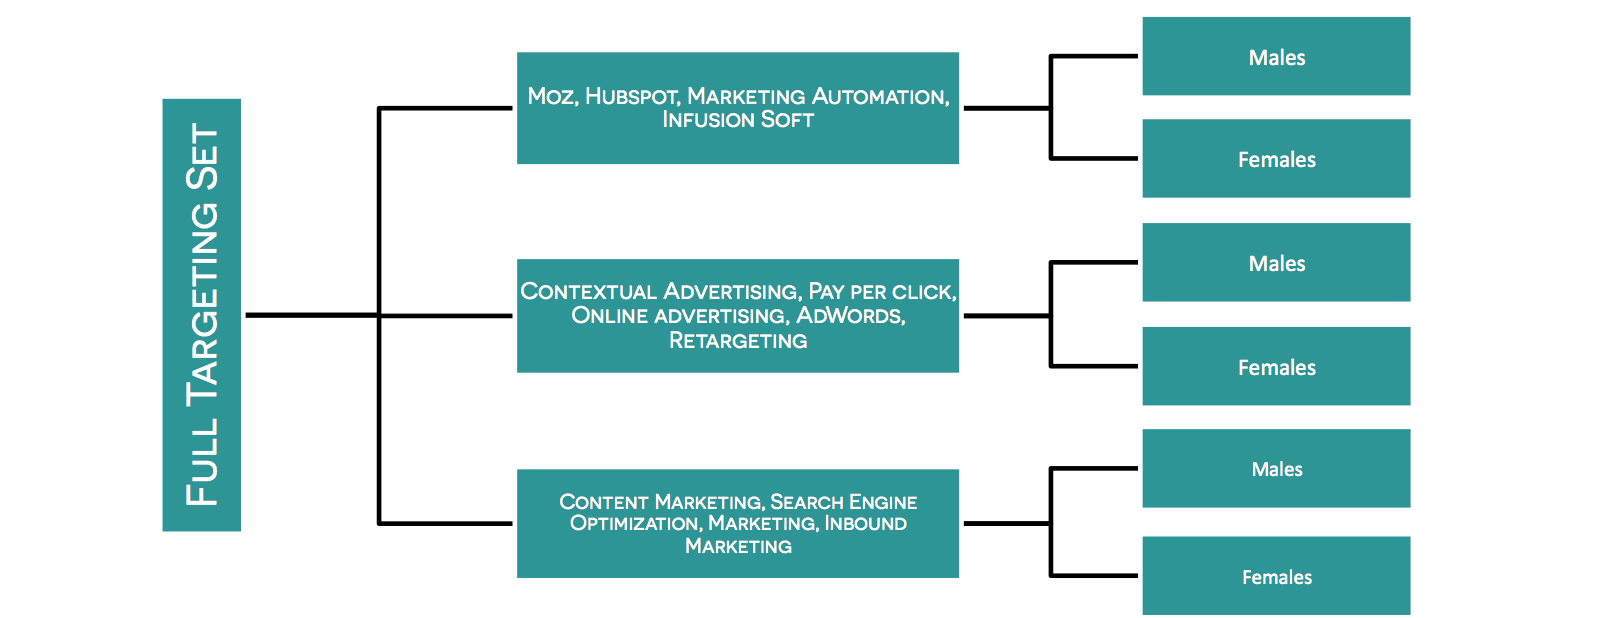 In this scenario you might see that the female section of the marketing tools targeting set (Moz, Hubspot etc) is not performing well in terms of your CPA. By having segmented like this you are able to optimise efficiently, as you can quickly stop that targeting set if necessary, or make changes to it to enable performance.
Likewise with placement and creative, you will be able to phase out those ads that aren’t working quickly if you have set everything up in the right way. The Facebook reports section within the ads system is your best friend for helping you with this data. You can filter by data sets to see everything you need quickly. As you see in the examples shown, we’d be pausing or decreasing spend on the segments highlighted in red, whilst those highlighted in orange are those that present a real opportunity and needs to be developed further.
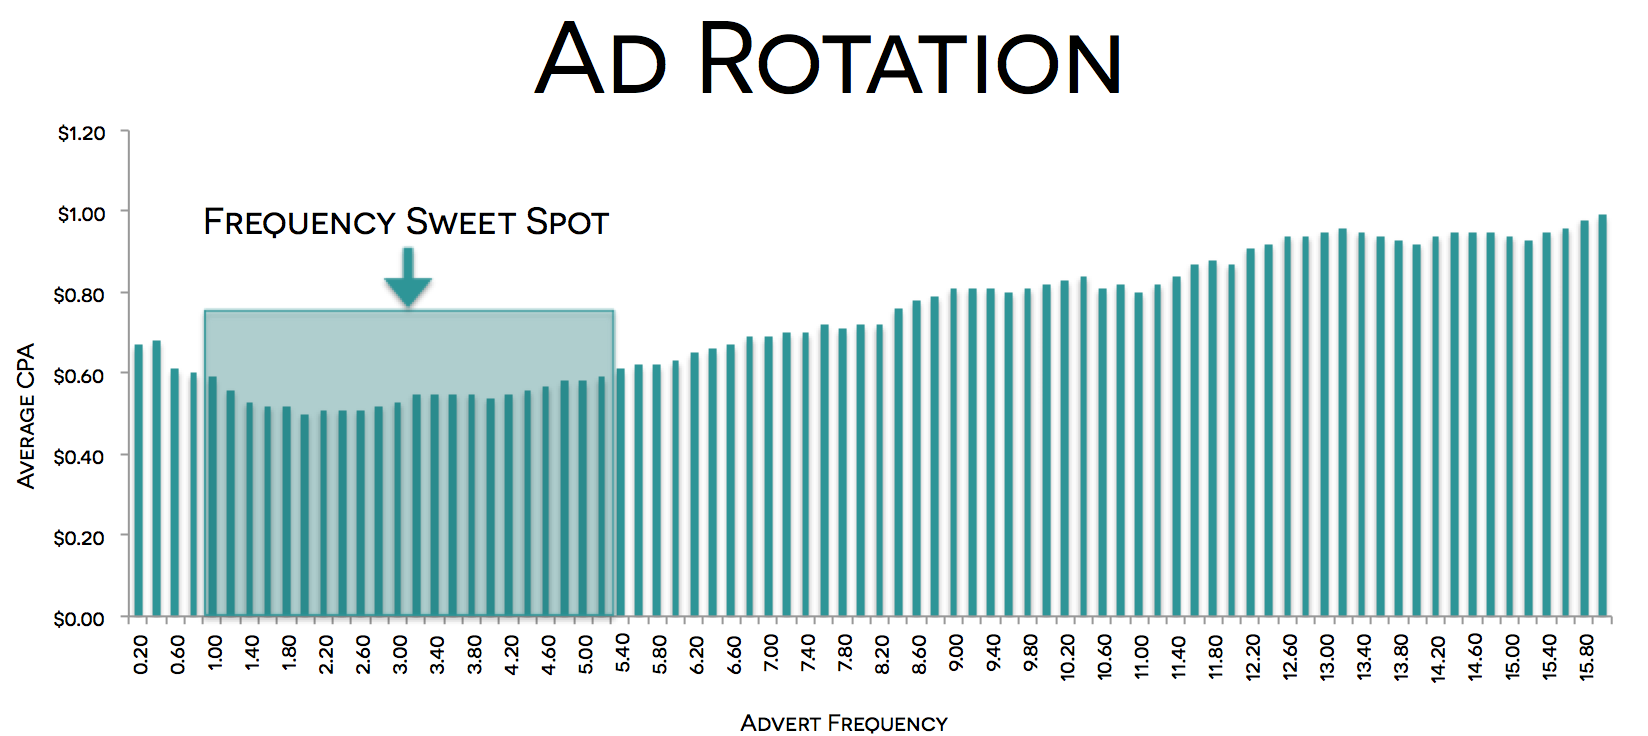
Ad rotation is an important factor to optimise for as well at this stage. It’s often forgotten about, but we’ve done a studied with a selection of our clients which has shown that there is a frequency sweet spot when it comes to the average CPA. If your ad is being shown to a user over 5.40 times on average (the frequency) then your CPA will increase. This is common sense in many ways, as if a user has seen your ad 7 or 8 times and isn’t converting then the messaging is most likely wrong, and you are wasting ad spend.
 Some Facebook advertising management tools such as Ad Parlor and Qwaya, can help you by letting you add in ad optimisation rules. Examples of these would be:
- If CPC =>$0.50 then pause ad
- If frequency => 5.4 then pause ad
- If CPA =< $0.55 and daily budget is reached then +20% to the daily budget
- If reach =< 1,000 and CPA =< $0.40 then +5% to CPC
Optimising in this way will allow you to bring your CPA down and give you confidence to increase your spend and therefore increase the number of total conversions.
This three step process is fairly universal - the key lies in the data insight step, where the more you can draw out about your audience, the better equipped you will be to create smarter targeting sets and to optimise effectively.
Good luck with creating your new campaigns, and any questions then please let me know either after or via Twitter.